Data-Copilot: Bridging Billions of Data and Humans with Autonomous Workflow
Data-Copilot: Bridging Billions of Data and Humans with Autonomous Workflow
Wenqi Zhang, Yongliang Shen, Weiming Lu, and Yueting Zhuang. Data-Copilot: Bridging Billions of Data and Humans with Autonomous Workflow: arXiv:2306.07209[Z]. arXiv,2023. (2023–06–12).
背景
金融、气象、能源等各行各业每天都会生成大量的异构数据。人们急切需要一个工具来有效地管理、处理和展示这些数据。
人们期待通过部署大语言模型(LLMs)来自主地管理和处理海量数据,即它连接不同领域(股票、基金、公司、经济和实时新闻)的丰富数据,满足多样化的用户查询,计算,预测,可视化等需求。
目标
只需要输入文字告诉 DataCopilot 你想看啥数据,无需繁琐的操作,无需自己编写代码, DataCopilot 自主地将原始数据转化为最符合用户意图的可视化结果,因为它可以自主地帮你找数据,处理数据,分析数据,画图, 无需人类协助。
挑战
- 从数据角度看:使用 LLM 直接读取和处理海量数据不仅不切实际,而且存在数据泄露的潜在风险。
- 从模型角度看:LLM 不擅长处理数值计算,可能没有合适的可调用外部工具来满足不同的用户请求(或者说难以穷尽可能需要的外部工具且工程量巨大),从而限制了LLM的利用率。
- 从任务角度看:虽然 LLM 已经表现出很强的 few-shot 能力,但许多与数据相关的任务错综复杂,需要许多操作的组合,如数据检索, 计算和表格操作以及结果需要以多种格式呈现,包括图像、表格和文本,所有这些都超出了 LLM 的当前能力。
主张
如何有效地从数据中提取信息取决于我们拥有的工具类型。因此,论文提出LLM不应直接处理数据,而应充当大脑,创建适当的接口工具来管理和利用数据,并以人为中心的方式呈现有价值的信息。
主要贡献
- 设计了一个通用的处理数据相关数据的智能系统,将不同领域的数据源和多样化的用户需求连接起来,通过将 LLM 集成到整个流程中,减少了繁琐的劳动和专业知识。
- Data-Copilot 实现自主管理、处理、分析、预测和可视化数据。当接收到请求时,它将原始数据转化为最符合用户意图的信息性结果。
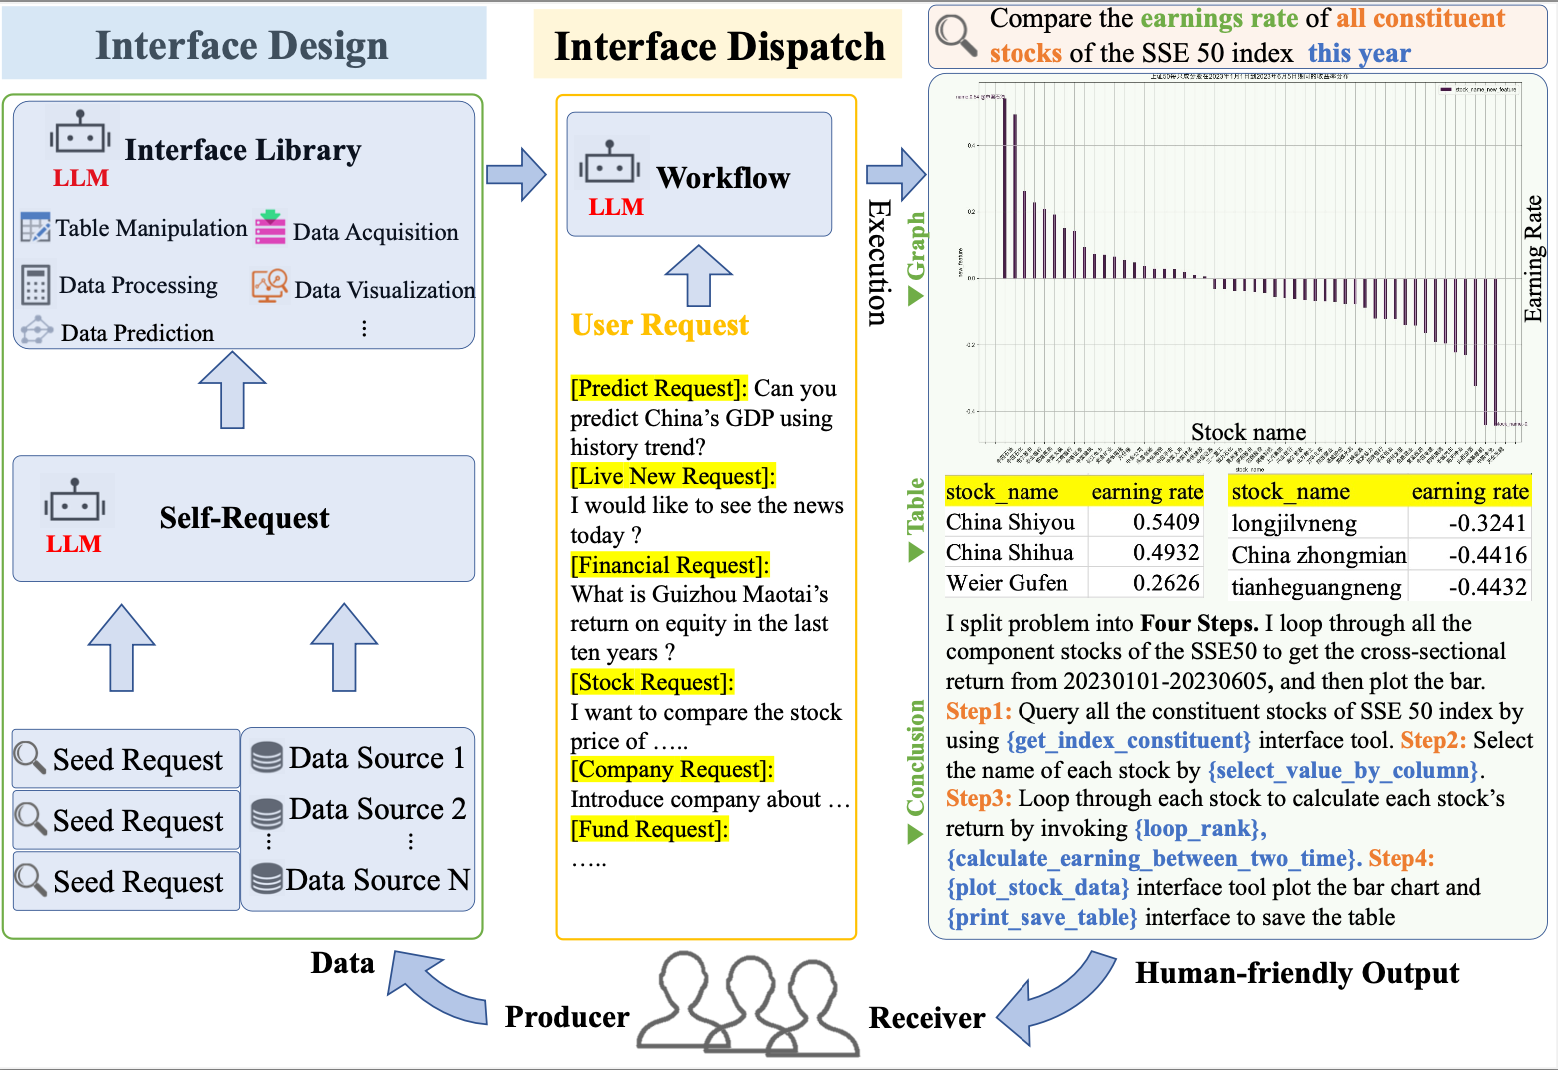
- Data-Copilot 作为设计者和调度者,包括两个过程:接口工具的设计过程 (设计者) 和接口工具的调度过程 (调度者) 。
- 基于中国金融市场数据构建了 Data-Copilot Demo。
主要方法
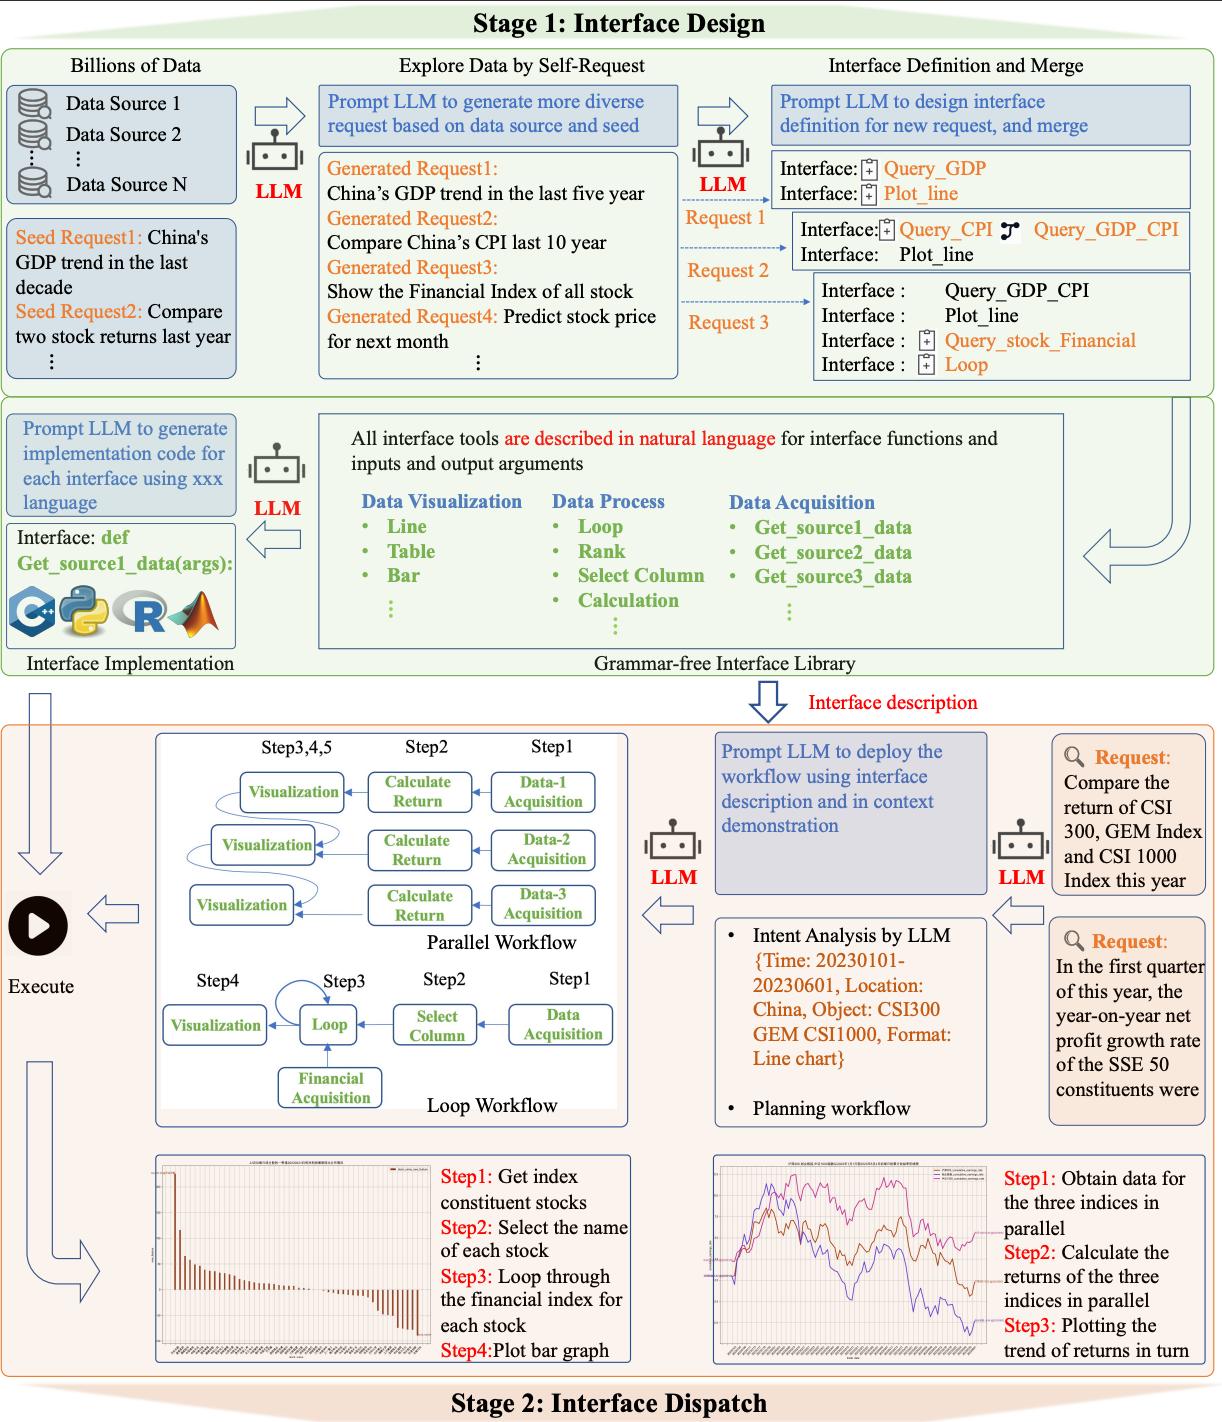
- 接口设计:研究设计了一个 self-request 的过程,使 LLM 能够自主地从少量种子请求生成足够的请求。然后,LLM 根据生成的请求进行迭代式的设计和优化接口。这些接口使用自然语言描述,使它们易于扩展和在不同平台之间转移。
- 接口调度:在接收到用户请求后,LLM 根据自设计的接口描述和 in context demonstration 来规划和调用接口工具,部署一个满足用户需求的工作流,并以多种形式呈现结果给用户。
完整流程
接口设计
整个阶段离线完成(仅与大模型通讯),自动生成的接口库包括了5类接口:data acquisition, processing, DataFrame manipulation, visualization and prediction。
数据获取
数据处理
计算
数据帧操作
合并同类项、选择、
数据可视化
数据预测
接口调度
意图分析 Intent Analysis
预设了解析 时间、位置、数据对象和输出格式
prompts:
Analysis prompt: Please parse the input instruction for time, place, object and output format and rewrite the instruction according to today’s date, the rewritten new instruction must be semantically consistent and contain a specific time and specific indicators. Use the following format to output {Time:%s, Location :%s, Object :%s,Format :%s}.
Demonstration1:
### Instruction: Today’s date is 2019-03-13,please help me plot the stock price trend of Guizhou Maotai from January 23, 2018 to today.
###New Instruction: Please help me plot the closing price of Guizhou Maotai from Jan 23, 2018 to Mar 13, 2019
(Time:20180123-20190313, Location: China, Object: Guizhou Maotai stock price, Format: Line
任务选择 Task Selection
从预测的基金任务、股票任务、金融任务、可视化任务中选择待实现的任务序列。
prompts
Select_prompt: Please select the most suitable task according to the given instruction and generate its task_instruction in the format of task={task_name: task_instruction}. There are four types of optional tasks.[fund_task]: used to extract and process tasks about all public funds. [stock_task]: for extracting and processing tasks about all stock prices, index information, company financials, etc., [economic_task]: for extracting and
processing tasks about all Chinese macroeconomic and monetary policies, as well as querying companies and northbound funds, [visualization_task]: for drawing one or more K-line charts, trend charts, or outputting statistical results. Use the following format to output task1={%s: %s},task2={%s: %s}.
Demonstration1:
###Instruction: Please help me plot the closing price of Guizhou Maotai from Jan 23, 2018 to Mar 13, 2019
###Plan: task1={\“stock_task\”:\“ Get the time series data of Guizhou Maotai’s stock price from 20180123 to
20190313\”}, task2={\"visualization_task\":\" Plot the stock price of Guizhou Maotai from 20180123 to 20190313 on a line chart \"
计划流程 Planing Workflow
根据任务选择合适函数及参数,得到返回值
prompts
Planning prompt: Please use the given interface(function) to complete the Instruction step by step, at each step you can only choose one or more interface from the following interface library without dependencies, and generate the corresponding arguments for the interface, the arguments format should be strictly in accordance with the interface description. The interface in the later steps can use results generated by previous interfaces.Please generate as json format for each step:step1={\n \“arg1\”:[arg1,arg2...],\n \“function1\”: \“%s\”,\n \“output1\”: \“%s\”,\n \“description1\”: \“%s\”\n}, step2={\n \“arg1\”: [arg1,arg2..],\n \“function1\”: \“%s\”,\n \“output1\”: \“%s\”,\n \“description1\”: \“%s\”\n}, ending with ###.
Demonstration1:
###Instruction: Get the time series data of Guizhou Maotai's daily closing price from Jan 23, 2018 to Mar 13,
2019
####Function Call: step1={\n \“arg1\”: [\“Guizhou Maotai\”,\“20180123\”,\“20190313\”,\“ daily\”],\n \“function1\”: \“get_stock_prices_data\”,\n \“output1\”: \“result1\”,\n \“description1\”: \“Guizhou Maotai daily stock price (open, close, high, low, etc.) time series data\”,\n “\n}, step2={\n \"arg1\": [\"result1\",\"close\"],\n \"function1\": \"calculate_stock_index\",\n \"output1\": \"result2\",\n \" description1\": \"Guizhou Maotai'sclosing price time series data\"\n}, step3={\n \"arg\": [\"result2\", null, "line\", \" Guizhou Maotai closing price chart from January 23, 2018 to March 13, 2019 \"],\n \"function\": \"plot_stock_data\",\n \"output\": \"result1\",\n \"description\": \" Guizhou Maotai Stock Price Line Chart \"\n} ###
多维度输出 Multi-form Output
主要是图表等,这个是在 prompt 里指明要进行的一个步骤
参考
Repo: https://github.com/zwq2018/Data-Copilot
Arxiv: https://arxiv.org/abs/2306.07209
Demo: https://huggingface.co/spaces/zwq2018/Data-Copilot